Markets Illuminated: Sell in May?
There's an old adage amongst seasoned investors "Sell in May and go away".
Where did that saying come from? And does it hold any validity?
Many decades of analysis on the S&P 500 Index shows that there actually is data to support that historically from May to October the index has worse performance than from November to April.
Does this mean that it's a fail proof strategy? Of course not.
Educated investors recognize that "past performance is not indicative of future results". However, sometimes it can be fun to look into these seeming anomalies and understand where they come from and why there can appear to be validity to them.
The bulk of the data supporting the "Sell in May and go away" approach comes from an era of investing prior to the mass digitization of information and when stock brokers were elbow to elbow in the trading pits of the NYSE (New York Stock Exchange). Traders would literally go away in May and take their vacations over the Summer and thus volume would dry up and return in the Fall with the literal return of brokers to their day jobs.
Today's environment is vastly different with high speed fiber optic cables running under foot across the country and markets being very close to open 24/7 when you factor in after hours trading, overseas trading, and actual 24/7 markets with crypto trading. Markets move fast, information moves faster, and these days the narrative is that the market front-runs the data. If you are hearing it on CNBC you are already late to the party.
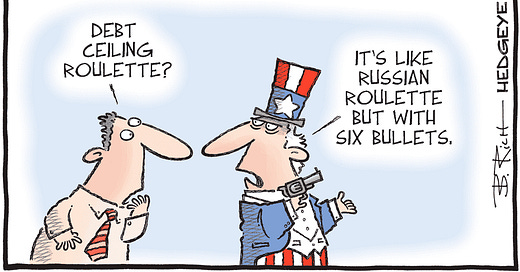
So what does this mean for the impending debt ceiling deadline?
If we are to believe that the market front-runs the data, and it has some inside edge on information, then it would seem to indicate that the market participants largely believe that this will be a non-factor. However, I like to step away from narratives and stories and look more closely at what the data shows.
If we take a look at the S&P 500 Index for some insights what do we see?
YTD performance just under 10%
Top two performing stocks in the Index (NVDA & META) are both up nearly 100% YTD
Over 50% of the stocks in the index are negative YTD
Top two stocks in the Index (NVDA & META) are both flat or down last 18-months
Top 50 stocks in the Index have nearly double the performance YTD
5-year performance of the Top 50 and the total Index are extremely close
Sources: Slick Charts & SP Global
A few of my takeaways from looking at this data (in concert with many other data points):
Encouraging that the S&P 500 Index is starting the year strong, historical data suggests more often than not this bodes well for positive performance for the year
Very discouraging that the majority of the index performance is concentrated in very few names, suggesting a "flight to quality" when compared to the small cap Russell 2000 Index, which is roughly flat YTD
Zooming out on the top index performers paints a less optimistic picture if we are indeed in a multi-year bear market, which are incredibly rare:
1929 - 1932
1939 - 1941
1973 - 1974
2000 - 2002
What we don't know?
What the performance of the S&P 500 Index will be for the year, or any index for that matter. These are matters for speculation that sell newspapers, get viewers to watch TV programs, and make for encapsulating water cooler talk.
Whether the debt ceiling showdown will end like it did in 2011 with a 15%+ loss in the S&P 500 shortly thereafter and a down year for the market, or like it did in 1995 with only two very shallow down months shortly thereafter and nearly 30% return for the index that year.
What do we know?
Having a plan built to weather market downturns and deliver sustainable income will help our mental health and enable us to take advantage of the "8th wonder of the world" according to Albert Einstein... compound interest. The longer term average of the S&P 500 Index is roughly 10% annualized. Investors that are able to remain invested and avoid taking income from securities that are impaired (negative performance) will end up better off than those that have no alternative to selling securities for income during periods of market distress.
It seems very likely to me that this will be a volatile year in the market and if you pay too much attention to financial media you may find yourself spun into a frenzy. So I'll leave you with this last nugget...
Since 1985, the first month of the year has seen the S&P 500 Index with 3%+ gains 15 times. Of those 15 instances, 10 years have ended with the S&P 500 providing positive performance and 4 years have ended with negative performance.
The fifteenth? You'll just have to wait to find out...


