
The F--- Bucket

Bitcoin is pumping. The bear market is over. We can all rejoice! Spring is nearly upon us and hibernation is ending. We can wake up from our slumber — if you’ve been in stable coins — or if you have been riding the HODL rollercoaster it’s time to chug back up the track!!
Or is it?
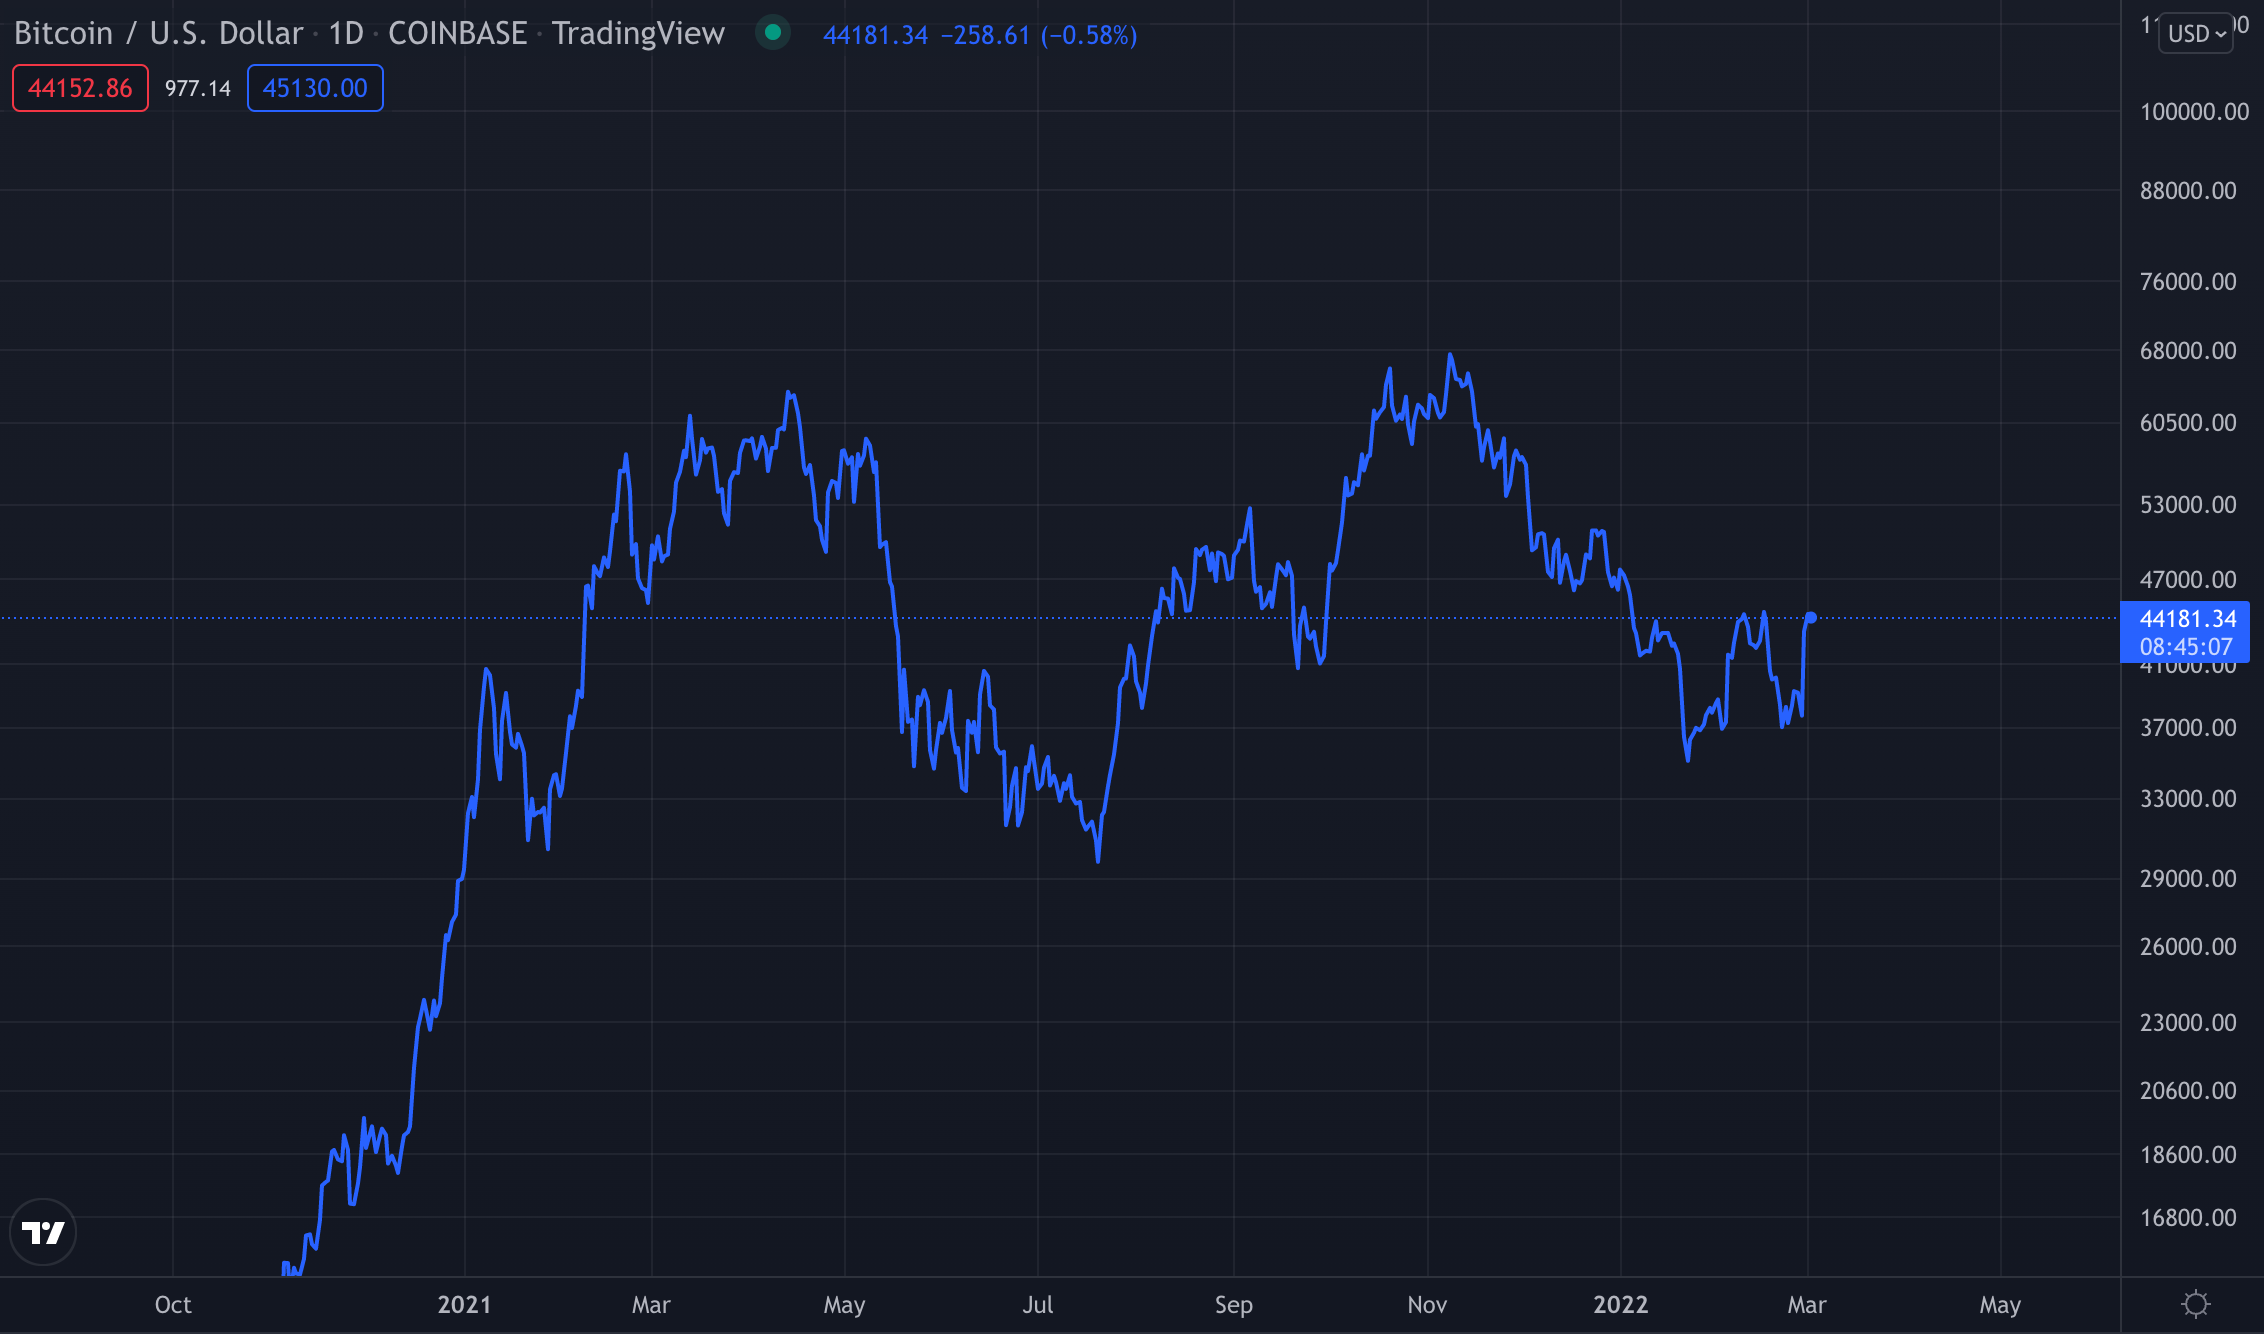
Here is the snapshot from just three days ago on March 2nd. I was getting all kinds of messages from my friends and followers. Is the bottom finally in? Are we really going to retest 33k again? Do you think that this is the start of a new bull run? My intention was actually to finish this article at that time and many of you I sent back direct messages saying not to buy the FOMO relief rally as I’ve said in numerous previous articles.
I just hope you listened and you didn’t deploy your cash. Lets digress back to stonks for a moment as the correlation between the SP500 Index and Bitcoin has risen substantially this year compared to years previously. I get pushback a lot when I talk about this point in particular, but the fact remains they are correlated for the time being so as the market goes so goes Bitcoin. And what drives market prices in stocks?
Growth and inflation.
You can check out my previous video on why this matters here:

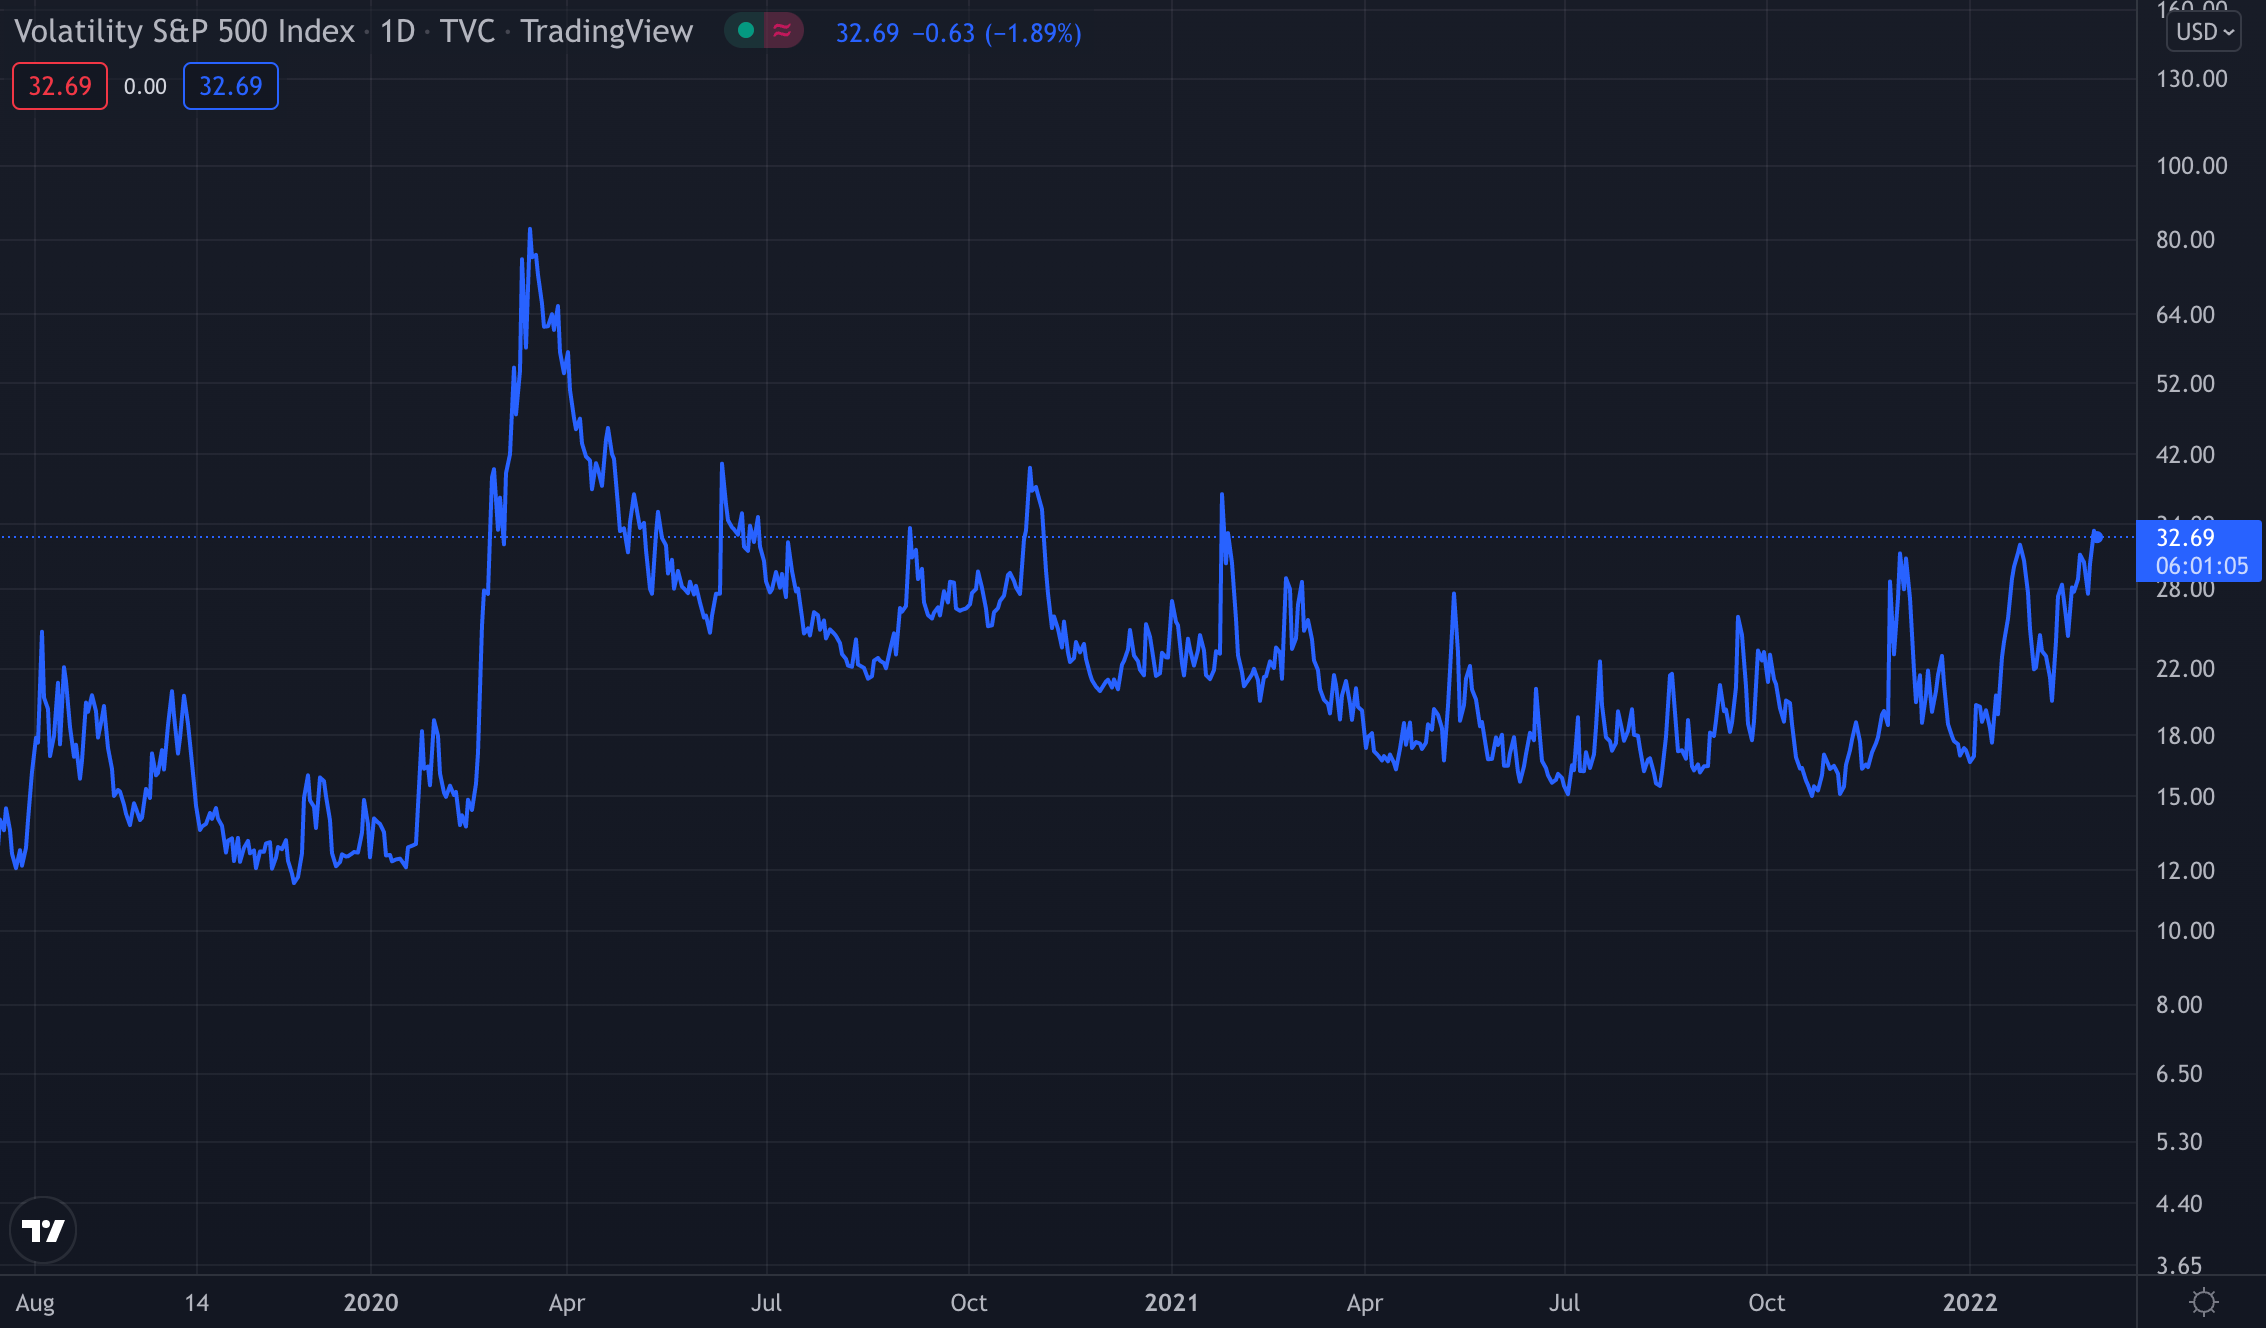
What was rising at the same time as the Bitcoin price was rising to 44-45k just a few days prior? Volatility.
Some refer to this as the fear gauge, but all you need to know is that a number in the 30’s in this chart is what we in the business call The Fuck Bucket. Do you want to be in that bucket? No. I didn’t think so. Nothing good happens when you step foot in there unless you are looking to get… well… you know…
So now let’s look at where are at in this moment. Below we are going to head back to Bitcoin and the horizontal lines drawn are the Fibonacci retracement bands. If you are unfamiliar with this please refer to my earlier work although I may write an article just on this topic alone in the future.
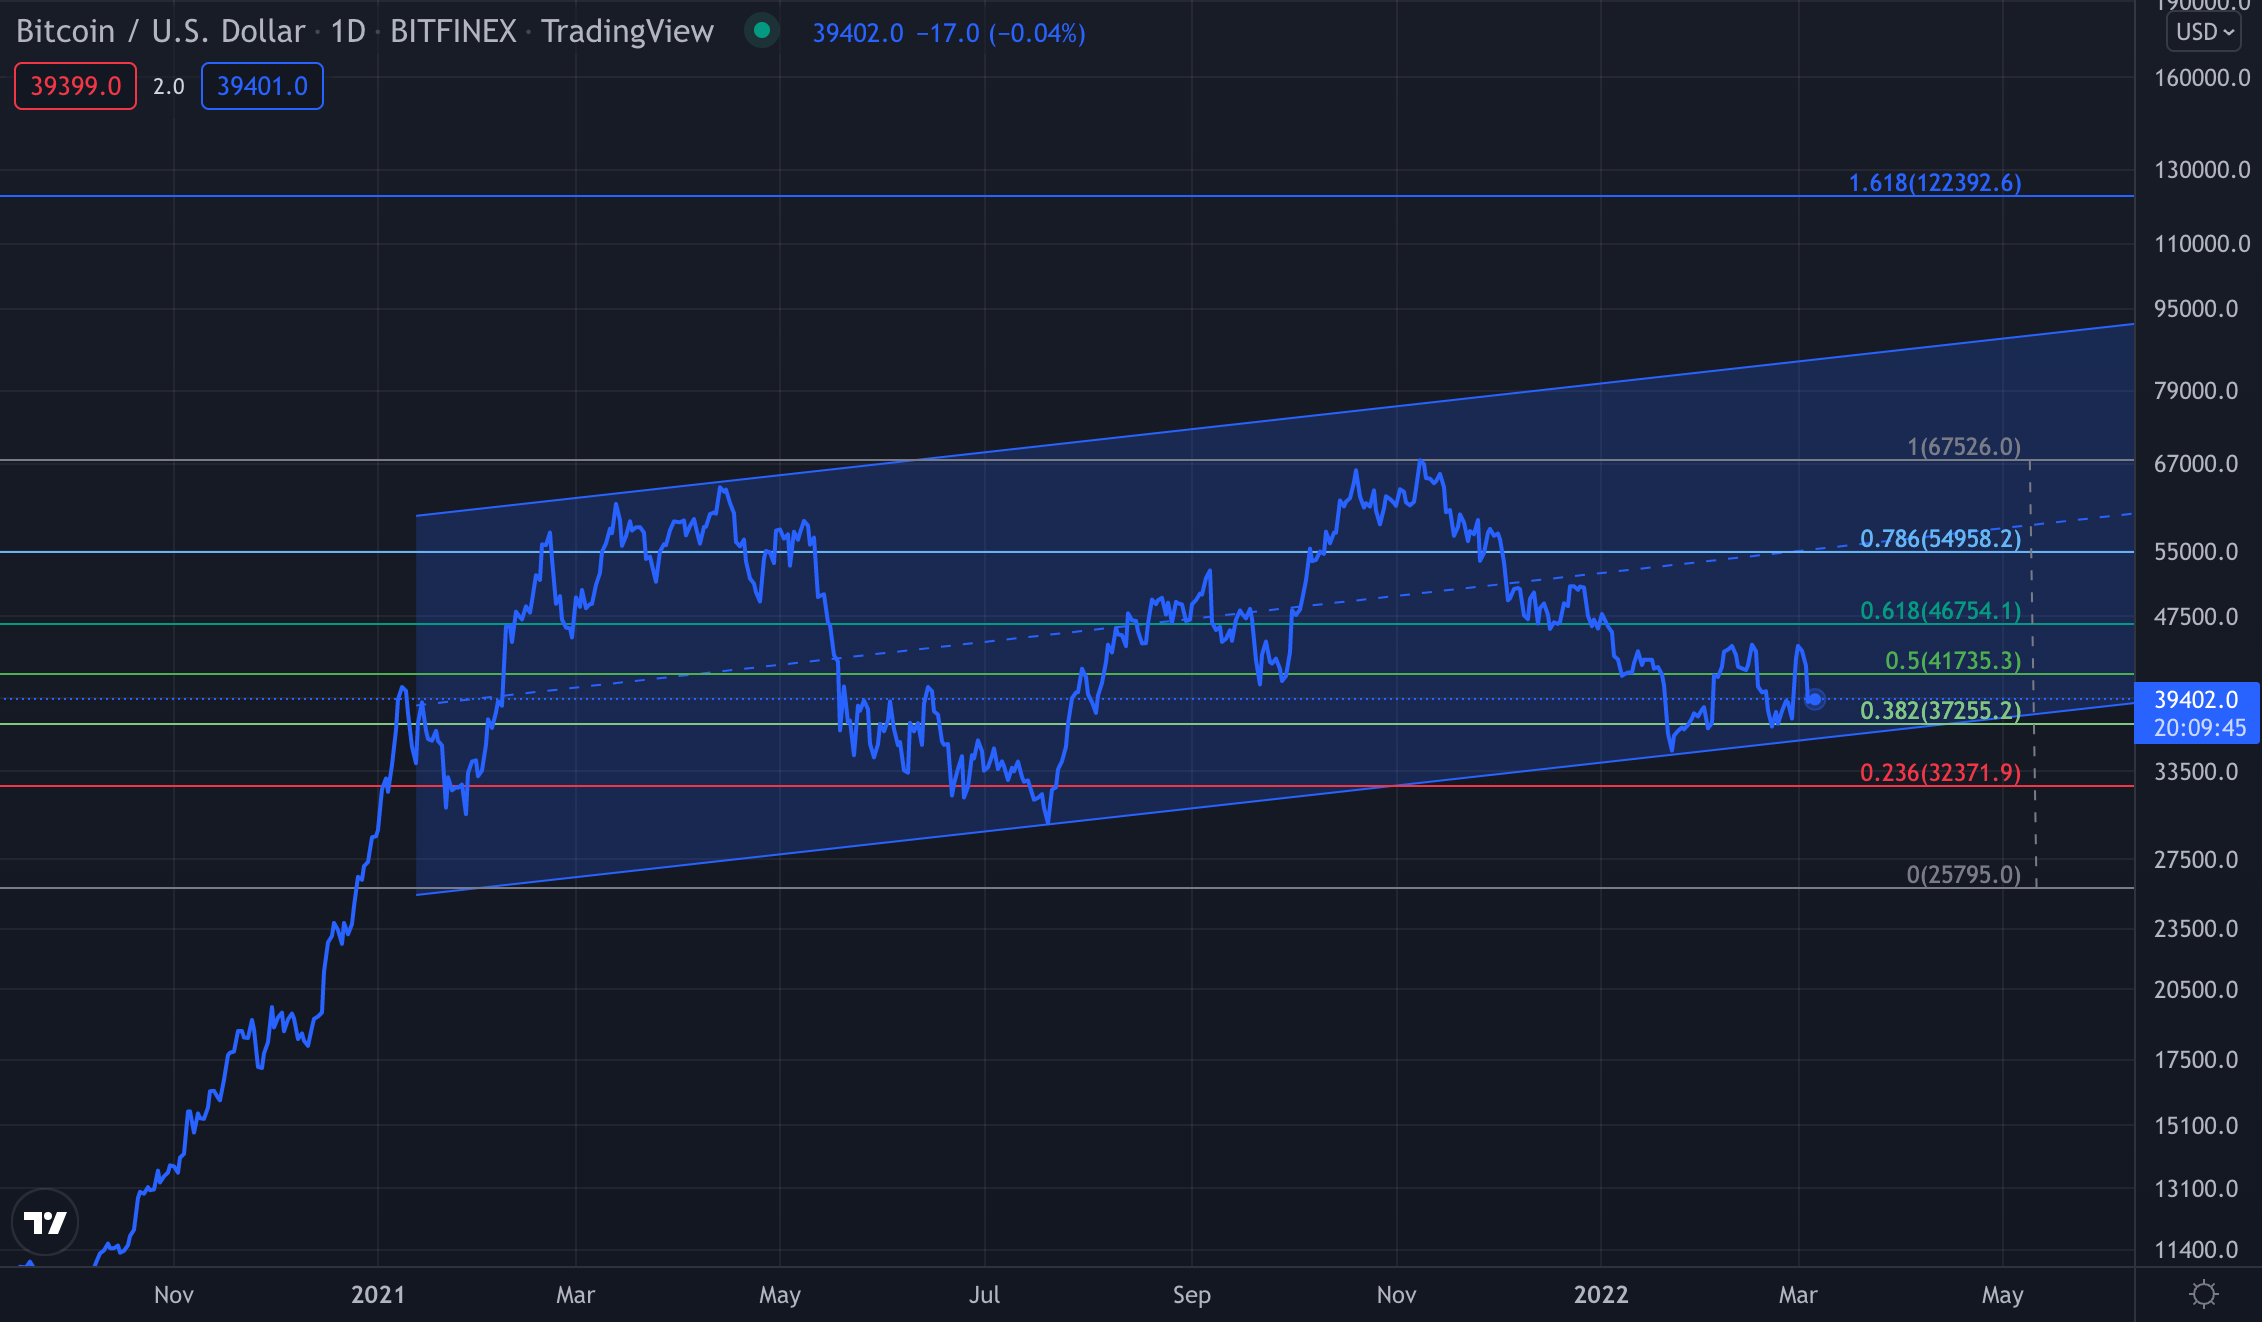
OK, so let’s simplify all the action in this chart. The grey horizontal line around 67k is the recent Bitcoin high. The bright red horizontal line around 32k is what is considered a full fib, or a full cyclical movement. You can certainly argue that we already completed that movement back on Jan 22 with a daily bottom of 35,104.
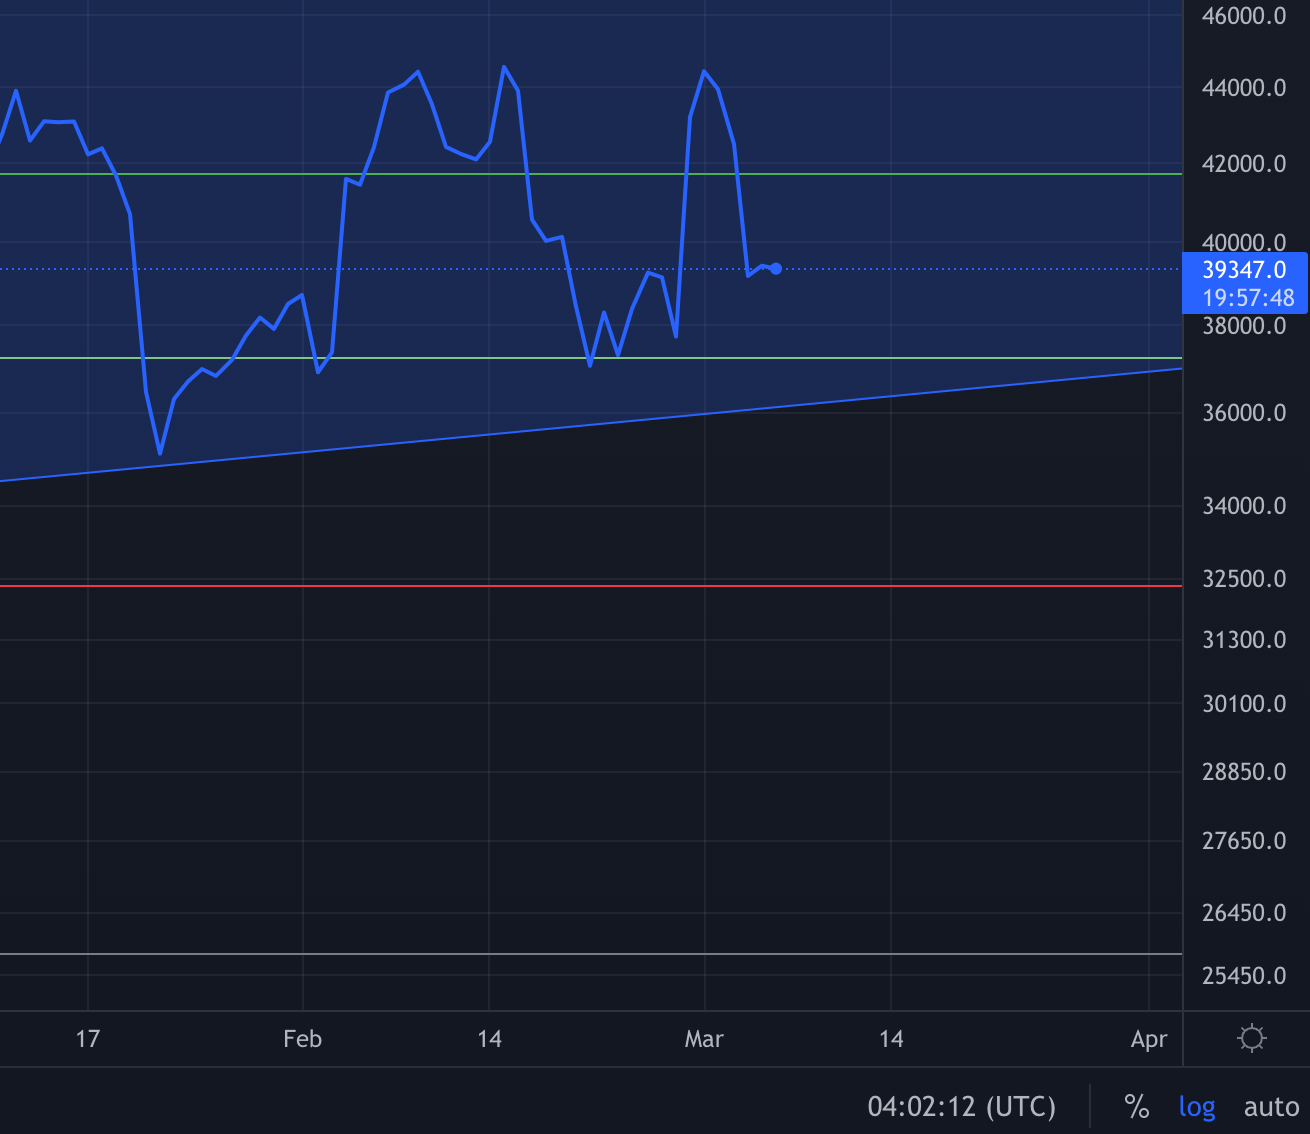
However, what tends to happen more often than not is a double or triple retest of a key Fibonnaci band in order to form a true bottom. Is it possible that the bottom of this Mandelbrot random walk is around the .382 fib of 37k? Sure. That might even make more sense since we broke it on Jan 22, tested it on Feb 2, and hit it again on Feb 21 and Feb 23.
I do what to go back though and draw your attention to the other component of this chart beyond just Fibonacci numbers, which I use as a key indicator of likely pivot points in any asset.
Below notice the shaded blue band called a parallel channel that I’ve drawn. This is fairly wide channel as you can see if we were to run up towards the top we would be approaching 100k — which I still think is a very real possibility in 2022 — and right now we seem to be skirting along the bottom of this channel.
So why does this matter?
The simple truth is that we have three crucial elements working against us right now and none of them are getting better anytime soon. If it wasn’t such a colossal headwind I might actually think that we are about to break free from this stone skipping across the pond.
Keep reading with a 7-day free trial
Subscribe to The Metaverse Illuminated to keep reading this post and get 7 days of free access to the full post archives.